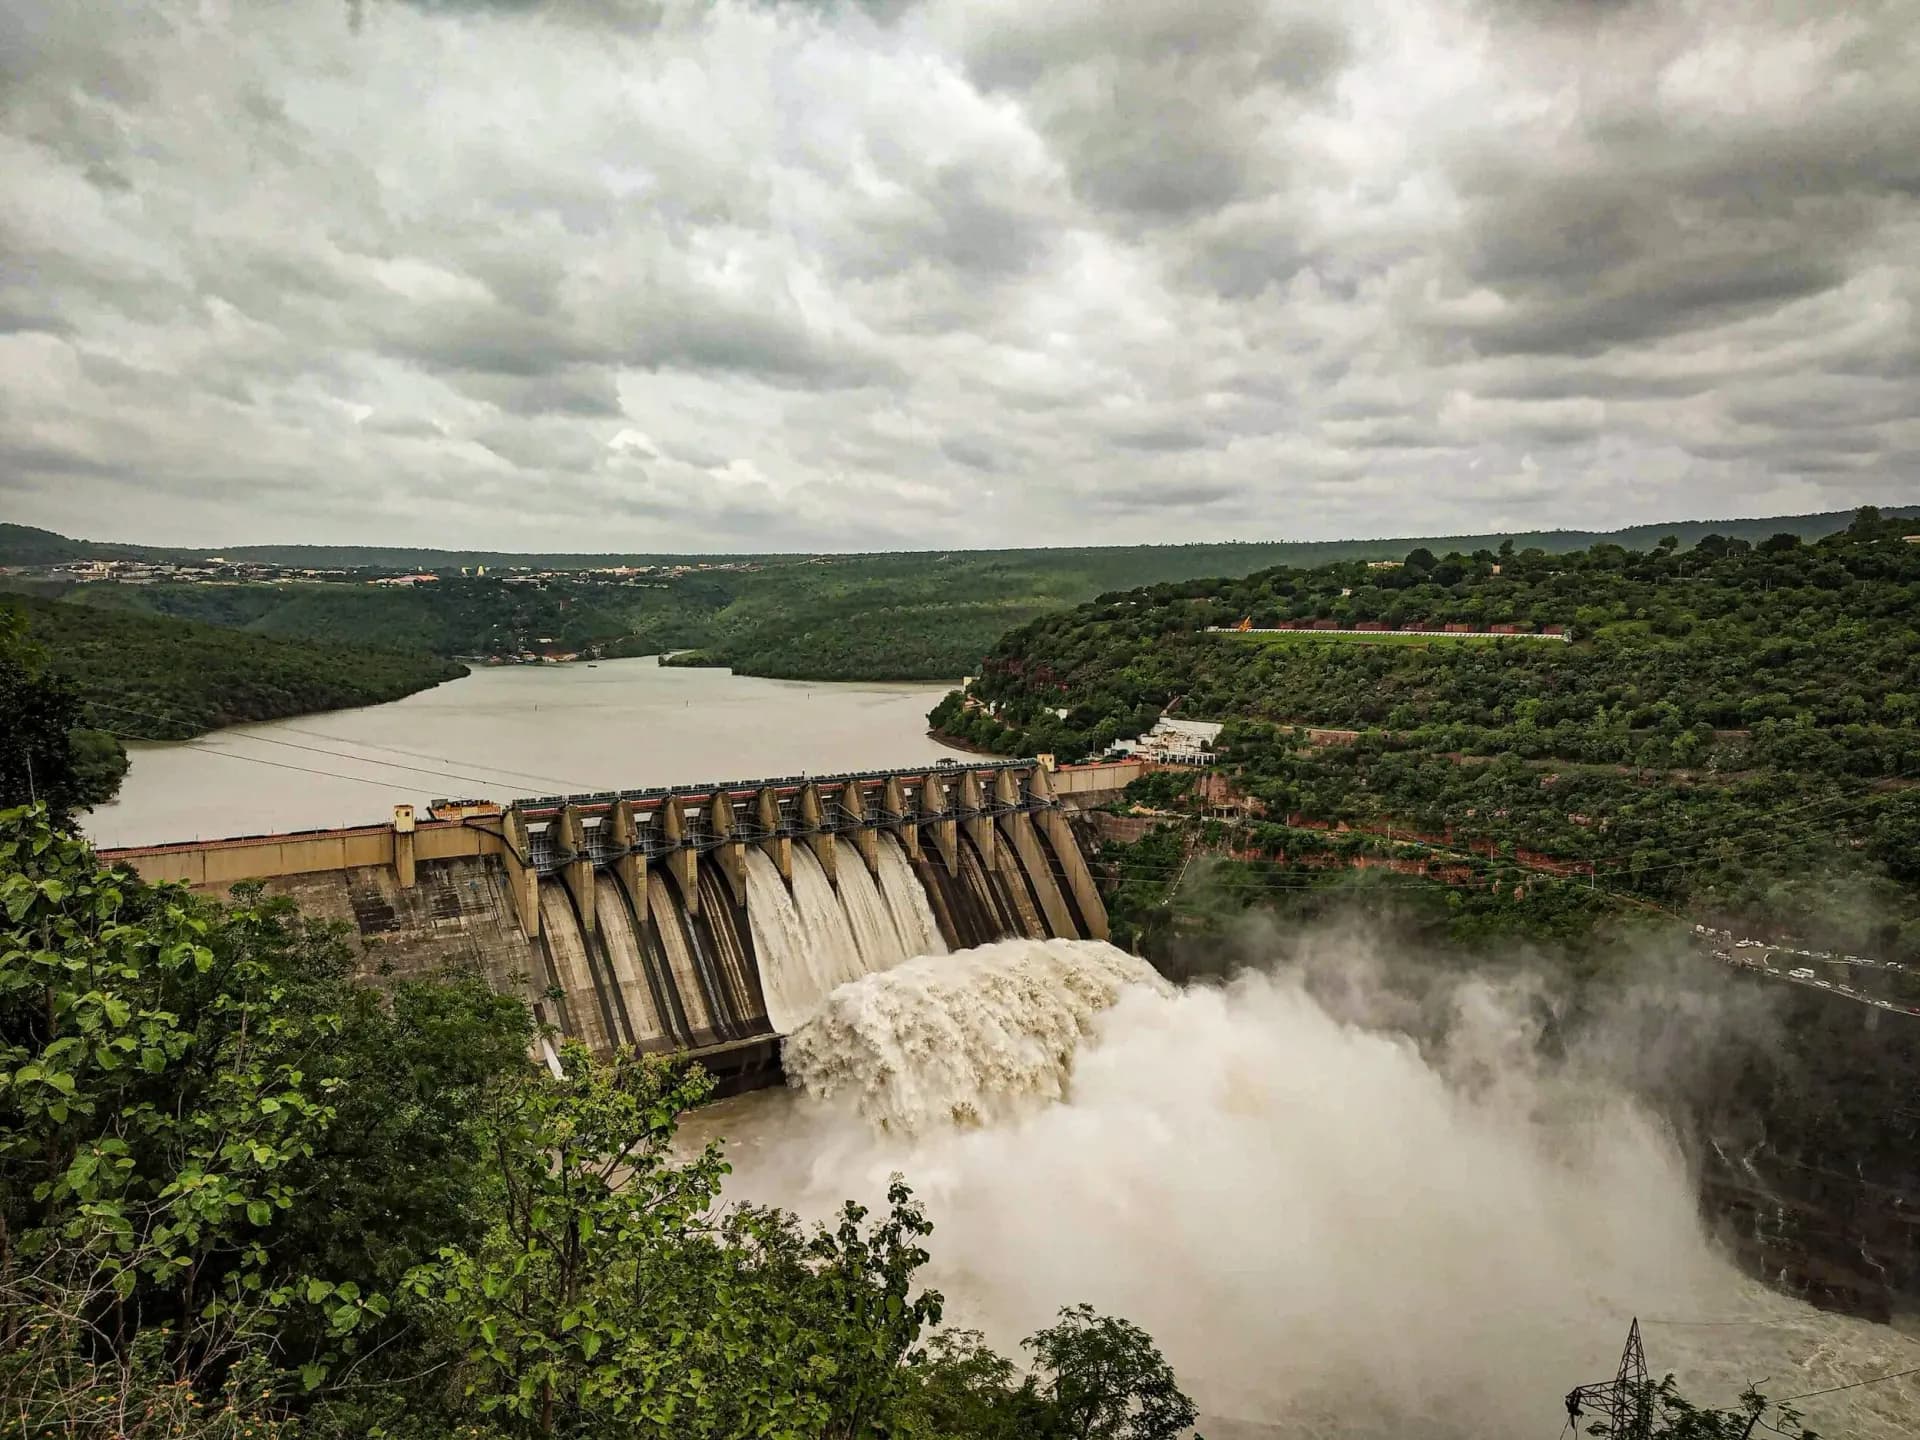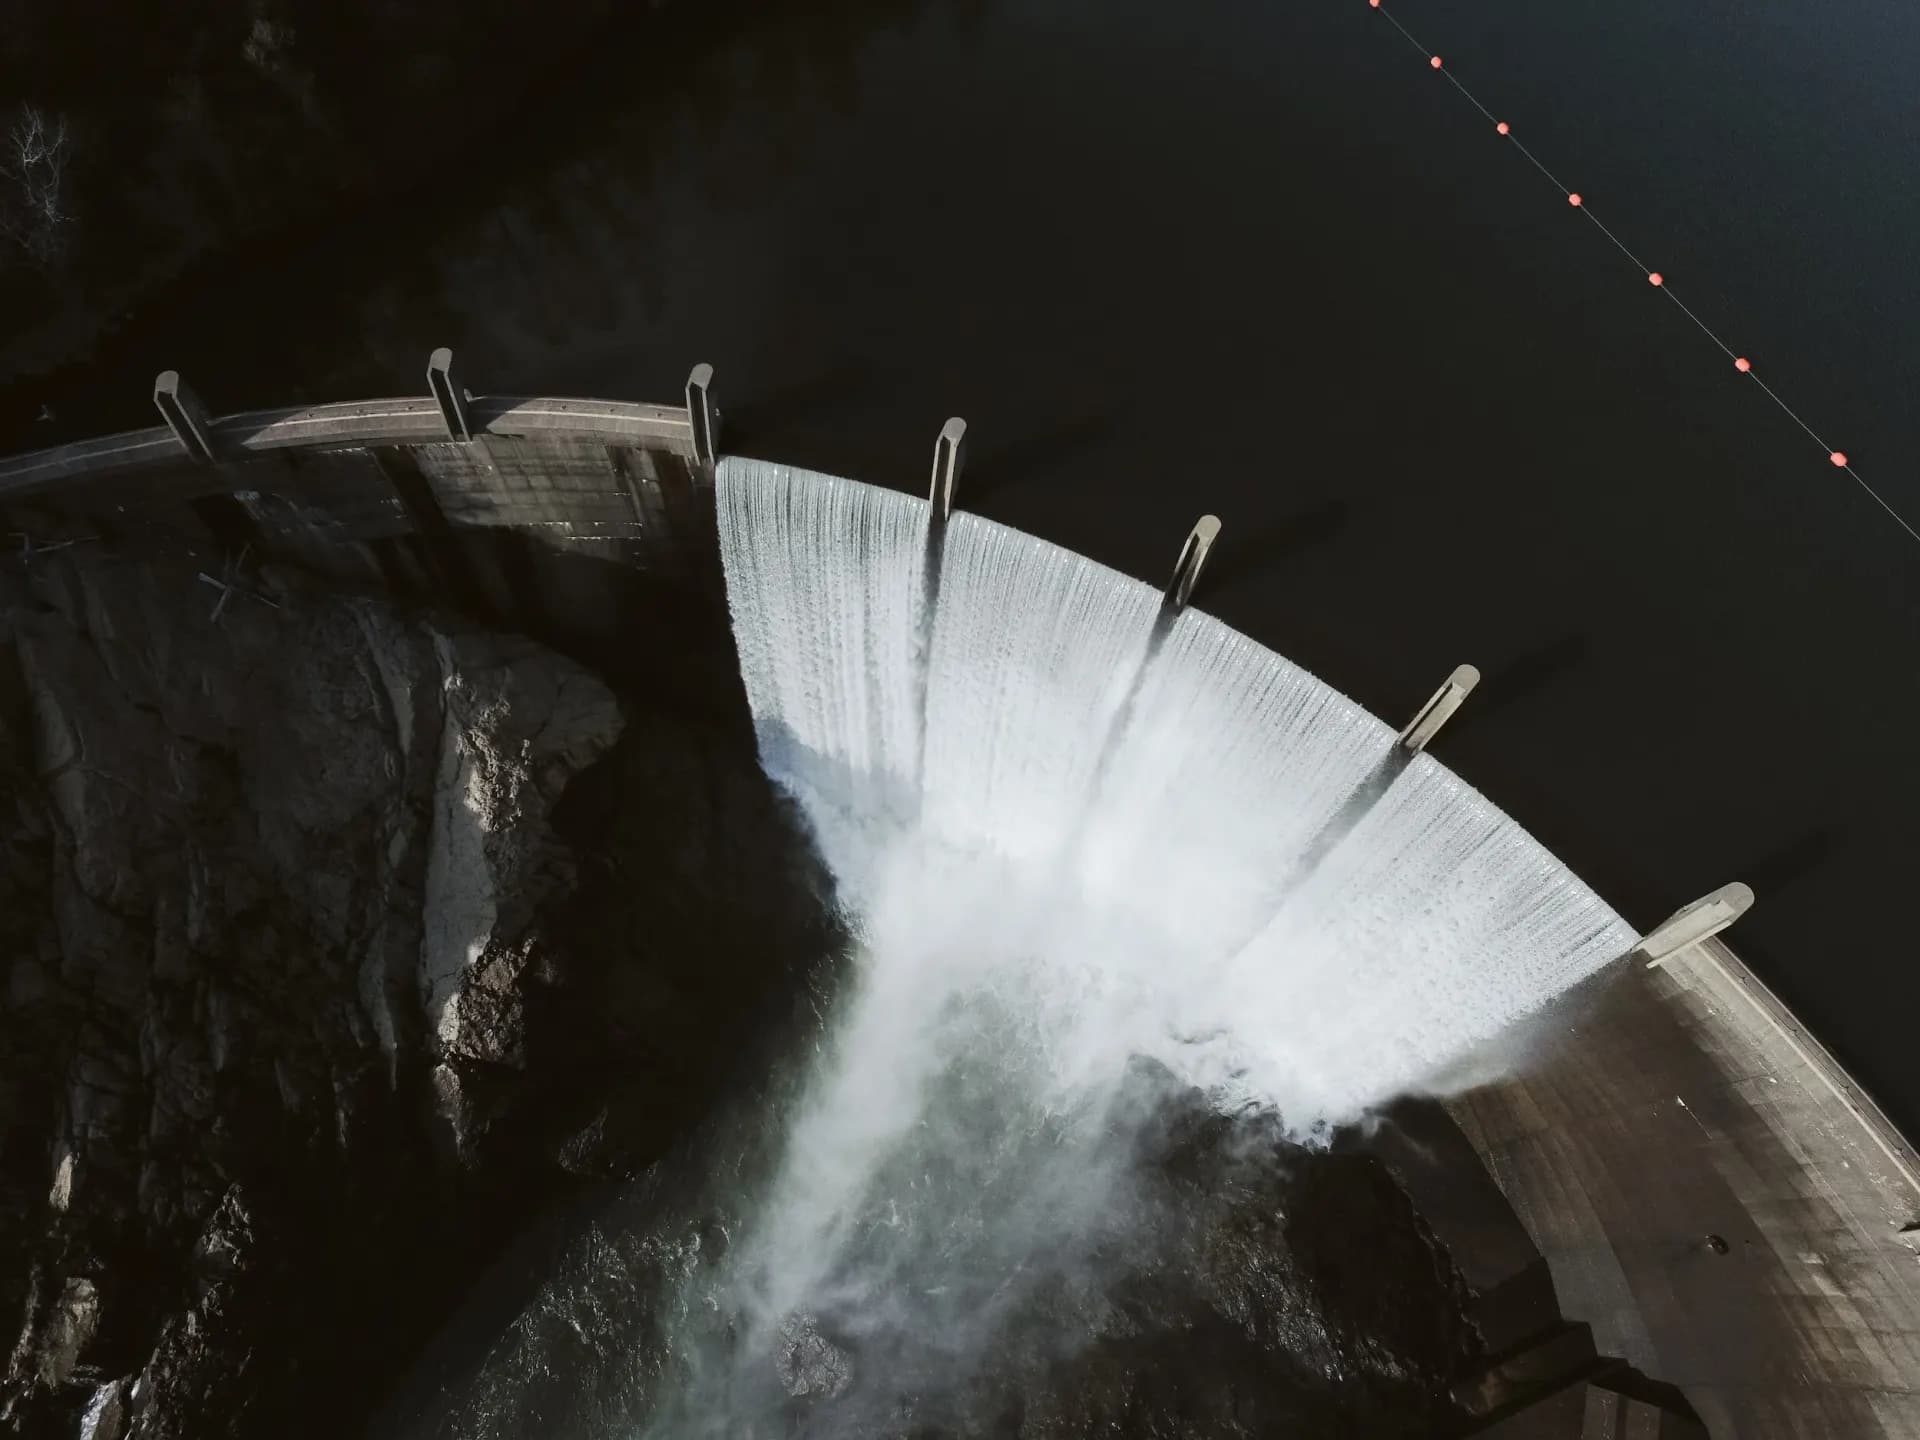
Water spilling over a concrete arch dam

DamSafety.IO

Know before, not after.

Earthquakes, sensors, storms and the people downstream, watched together in real time for every dam you are responsible for. When something changes, you hear about it first, with what it means for your dam.

What you can do

From the first tremor to the last structure downstream.

01Earthquakes

Every earthquake, measured against your dam

Each dam carries its own earthquake history from the USGS catalog. When a new quake is published, its magnitude and distance are checked against the response curves for that dam, so you know right away whether it calls for a response, and at what level.

92earthquakes of M2.5 and above in California and Nevada in the last 30 days.

Last 7 days (29) Earlier

Largest this month

M5.0 · 111 km W of Petrolia, CA

Nov 4, 8:56 PM PST · 10 km deep

View on USGS

Satellite view of California and Nevada
M3.1 · 80 km W of Bayview, CA · Oct 20, 12:39 AM PDTM2.9 · 39 km SSW of Qualeys Camp, NV · Oct 20, 12:52 AM PDTM2.8 · 32 km SE of Bodie, CA · Oct 20, 2:33 AM PDTM3.0 · 39 km SSW of Likely, CA · Oct 21, 8:55 AM PDTM3.0 · 14 km SE of Petrolia, CA · Oct 21, 6:43 PM PDTM3.0 · 20 km WSW of Gustine, CA · Oct 21, 9:18 PM PDTM2.8 · 238 km W of Ferndale, California · Oct 22, 1:22 PM PDTM3.0 · 15 km S of Tres Pinos, CA · Oct 22, 2:58 PM PDTM3.1 · 69 km W of Ferndale, CA · Oct 22, 10:38 PM PDTM2.5 · 17 km W of Alberto Oviedo Mota, B.C., MX · Oct 23, 9:43 AM PDTM2.9 · 19 km SW of Toms Place, CA · Oct 24, 3:54 AM PDTM2.8 · 204 km WSW of Pistol River, Oregon · Oct 24, 10:49 AM PDTM2.6 · 15 km NNE of Milford, Utah · Oct 24, 10:59 AM PDTM2.6 · 186 km W of Pistol River, Oregon · Oct 24, 3:16 PM PDTM4.6 · 204 km WSW of Pistol River, Oregon · Oct 24, 3:26 PM PDTM2.7 · 32 km WSW of Tecopa, CA · Oct 24, 6:35 PM PDTM2.5 · 4 km SE of Aromas, CA · Oct 26, 6:10 AM PDTM2.6 · 15 km E of Seven Trees, CA · Oct 27, 12:38 PM PDTM2.8 · 236 km W of Ferndale, California · Oct 27, 4:34 PM PDTM2.5 · 11 km SE of Ocotillo Wells, CA · Oct 27, 7:41 PM PDTM3.0 · 138 km SSW of Avalon, California · Oct 28, 4:54 AM PDTM4.0 · 10 km N of Lake Pillsbury, CA · Oct 28, 5:01 AM PDTM2.6 · 12 km SW of Ridgemark, CA · Oct 28, 4:29 PM PDTM2.7 · 2 km ENE of Pacifica, CA · Oct 28, 5:17 PM PDTM2.7 · 12 km SW of Ridgemark, CA · Oct 29, 5:38 AM PDTM2.6 · 22 km SSW of Big Pine, CA · Oct 30, 6:42 AM PDTM2.7 · 32 km W of Petrolia, CA · Oct 30, 6:56 AM PDTM2.7 · 32 km SE of Bodie, CA · Oct 30, 8:45 AM PDTM2.6 · 70 km WNW of Bayview, CA · Oct 30, 10:50 AM PDTM2.8 · 102 km W of Petrolia, CA · Oct 30, 3:13 PM PDTM2.9 · 28 km WSW of Westley, CA · Oct 31, 9:44 AM PDTM2.8 · 52 km W of Petrolia, CA · Oct 31, 4:21 PM PDTM2.9 · 55 km NNE of Gabbs, Nevada · Oct 31, 7:43 PM PDTM2.8 · 61 km W of Petrolia, CA · Nov 1, 4:31 AM PSTM2.7 · 79 km W of Petrolia, CA · Nov 1, 2:56 PM PSTM2.6 · 3 km ESE of Berkeley, CA · Nov 1, 6:23 PM PSTM3.2 · 9 km NNE of Delta, B.C., MX · Nov 1, 11:50 PM PSTM2.9 · 3 km SW of Brawley, CA · Nov 2, 4:31 AM PSTM2.6 · 7 km NW of The Geysers, CA · Nov 2, 7:14 AM PSTM2.5 · 9 km E of Lower Lake, CA · Nov 2, 1:02 PM PSTM2.6 · 15 km NNE of Milford, Utah · Nov 2, 3:26 PM PSTM2.8 · 7 km NNE of Delta, B.C., MX · Nov 2, 5:33 PM PSTM3.1 · 3 km NNE of Ejido Nuevo León, Mexico · Nov 2, 7:02 PM PSTM3.3 · 6 km NNE of Delta, B.C., MX · Nov 2, 7:02 PM PSTM3.5 · 8 km NNE of Delta, B.C., MX · Nov 3, 10:17 AM PSTM4.9 · 9 km N of Delta, B.C., MX · Nov 3, 10:27 AM PSTM3.0 · 7 km NNE of Delta, B.C., MX · Nov 3, 11:18 AM PSTM2.5 · 7 km NNE of Delta, B.C., MX · Nov 3, 11:35 AM PSTM2.5 · 15 km NNE of Milford, Utah · Nov 4, 3:53 AM PSTM3.1 · 21 km N of Searles Valley, CA · Nov 4, 10:59 AM PSTM2.7 · 21 km N of Searles Valley, CA · Nov 4, 11:15 AM PSTM5.0 · 111 km W of Petrolia, CA · Nov 4, 8:56 PM PSTM2.6 · 14 km N of Warner Springs, CA · Nov 5, 10:44 PM PSTM2.8 · 39 km WNW of Preston, Nevada · Nov 6, 1:34 PM PSTM2.7 · 14 km NE of Milford, Utah · Nov 7, 4:35 AM PSTM3.1 · 13 km NE of Milford, Utah · Nov 7, 10:10 AM PSTM2.7 · 14 km NE of Milford, Utah · Nov 7, 12:49 PM PSTM2.5 · 15 km NNE of Milford, Utah · Nov 7, 11:10 PM PSTM3.5 · 21 km W of Preston, Nevada · Nov 8, 5:55 AM PSTM2.6 · 1 km NNW of The Geysers, CA · Nov 8, 4:44 PM PSTM3.8 · 246 km W of Ferndale, California · Nov 8, 8:49 PM PSTM2.8 · 21 km W of Preston, Nevada · Nov 9, 2:56 PM PSTM2.7 · 1 km N of Lake Davis, CA · Nov 10, 8:16 AM PSTM2.6 · 1 km ENE of Aromas, CA · Nov 12, 11:40 AM PSTM2.5 · 8 km SE of San Pedro, CA · Nov 12, 6:11 PM PSTM3.5 · 16 km W of Preston, Nevada · Nov 13, 7:10 AM PSTM3.4 · 22 km WNW of Preston, Nevada · Nov 13, 7:34 AM PSTM2.6 · 8 km W of Holtville, CA · Nov 14, 3:05 AM PSTM3.0 · 8 km W of Holtville, CA · Nov 14, 3:09 AM PSTM3.0 · 7 km W of Holtville, CA · Nov 14, 3:12 AM PSTM2.5 · 8 km W of Holtville, CA · Nov 14, 3:13 AM PSTM3.0 · 7 km W of Holtville, CA · Nov 14, 3:13 AM PSTM2.9 · 8 km W of Holtville, CA · Nov 14, 7:33 AM PSTM2.7 · 8 km W of Holtville, CA · Nov 14, 7:34 AM PSTM3.0 · 6 km W of Burning Man Earth, Nevada · Nov 14, 11:51 AM PSTM3.4 · 106 km WSW of Pistol River, Oregon · Nov 14, 3:22 PM PSTM3.0 · 18 km SE of Silver Springs, Nevada · Nov 15, 11:58 AM PSTM3.2 · 164 km W of Trinidad, California · Nov 16, 6:02 AM PSTM2.8 · 16 km NW of Lopez Point, CA · Nov 16, 1:17 PM PSTM3.0 · 11 km ESE of Silver Springs, Nevada · Nov 16, 10:32 PM PSTM2.6 · 14 km NNE of Milford, Utah · Nov 16, 11:13 PM PSTM3.9 · 96 km SW of San Clemente Is. (NW tip), CA · Nov 17, 9:27 PM PSTM2.9 · 49 km W of Petrolia, CA · Nov 18, 5:05 AM PSTM2.9 · 33 km SE of Mina, Nevada · Nov 18, 5:56 AM PSTM3.3 · 91 km SW of San Clemente Is. (NW tip), CA · Nov 18, 5:58 AM PSTM2.5 · 14 km N of Susanville, CA · Nov 18, 10:49 AM PSTM3.4 · 18 km ENE of Borrego Springs, CA · Nov 18, 3:39 PM PSTM2.8 · 15 km NNE of Milford, Utah · Nov 18, 4:05 PM PSTM2.7 · 7 km SSW of Primo Tapia, B.C., MX · Nov 18, 10:02 PM PSTM3.5 · 42 km N of Kernville, CA · Nov 18, 10:40 PM PSTM2.8 · 19 km SW of Toms Place, CA · Nov 19, 4:24 AM PSTM3.0 · 19 km SW of Toms Place, CA · Nov 19, 5:58 AM PSTM5.0

Earthquakes: USGS earthquake catalog, refreshed every 15 minutes. Imagery © Mapbox, © Maxar.

02Your portfolio

Every dam in the National Inventory

92,152

Dams from the National Inventory of Dams are already on the map, so your portfolio starts with its basics filled in, and so does the dam upstream of yours.

Portfolio map with dam locations, recent earthquakes and fault lines

03Storms

See the rain coming

Every dam's rainfall forecast is checked against its own threshold, days ahead, alongside National Weather Service alerts and recent rainfall. When more rain is coming than a dam should see, the people responsible for it hear about it before the storm arrives.

Weather monitoring: precipitation radar, per-dam conditions and a 15-day precipitation outlook

04Instrumentation

Automated instrumentation, watched when you aren’t

Automated readings come in from your loggers day and night, and every one is checked against its thresholds the moment it arrives, including how fast it is changing. Nobody has to be looking.

  • Alerts that find you. Cross a threshold and the people responsible for the dam hear about it by email and in the app, and by text if they choose.
  • Silence is an alert too. If a sensor stops reporting, you hear about that as well.
  • Manual and automated, one record. Hand-taken readings from the field, the DamCollect app or a spreadsheet sit on the same chart as the automated trace, and the history carries on when a sensor is replaced. Few systems put the two side by side.
Instrument chart of flow rate, water elevation and precipitation over time
Dam cross-section with embankment layers, piezometers and the phreatic surface
Satellite view of Lake Oroville and the Feather River, California

05Hydrology

Your watershed, delineated for you

The tributary area above each dam is traced automatically and checked against its recorded drainage area, with the tributary arms and the dams upstream that catch runoff first. Then walk the divide in 3D terrain.

Lake Oroville and the Feather River, California. Imagery © Mapbox, © Maxar.

And on every dam

Know who is downstream

For California dams, the regulator-approved inundation map is pulled in with a count of what sits inside it: every structure with its daytime and nighttime population, plus schools, hospitals, child care centers and other critical facilities.

Field inspections, start to report

Guided inspection checklists, observations pinned to the map with photos and measurements, a report editor, and engineer-of-record review, all kept against the dam.

See your dams on DamSafety.IO

Already have an account? Sign in with your work Microsoft account. New to DamSafety.IO? Sign up and we'll get your organization set up.